February 2023 East Bay Market Report
Market Update

Market Update
Note: You can find the charts & graphs for the Big Story at the end of the following section.
If you’re an avid reader of our newsletters, you may recall discussions of a possible recession a few months ago. We, of course, weren’t the only ones talking about it, but it was a little early to opine. We’re happy to say that a recession likely isn’t on the horizon but that there is one major caveat: the debt ceiling. Before we discuss the debt ceiling, we’ll cover the economic indicators that brought us to the conclusion that we’re entering a period of slower economic growth rather than a recession.
Recessions used to be defined as a fall in Gross Domestic Product (GDP) for two consecutive quarters. For what it’s worth, Real GDP in the fourth quarter of 2022 was up 1% year-over-year and 0.7% quarter-over-quarter. However, the National Bureau of Economic Research (NBER) takes a more nuanced approach by considering nonfarm payrolls, industrial production, and retail sales, among other indicators. The U.S. employment rate is still strong despite some notable high-profile companies, especially in tech, announcing mass layoffs. The unemployment rate is 3.5%, which is about as low as we’ve seen in modern history. Additionally, initial unemployment claims and continued claims have been at pre-pandemic levels for about 13 months and 11 months, respectively. Total Nonfarm Private Payroll Employment data (seasonally adjusted) from ADP shows that job growth stagnated in the second half of 2022 but didn’t decline. With over 10 million job openings in the country, the level of unemployment should remain historically low for the foreseeable future. Generally, a high employment rate is good for both the housing market and the overall economy for fairly straightforward reasons: Employed people make money, so they can pay their bills and not default on their debt.
Inflation is still far above the Fed’s 2% target but is coming down. December 2020 was the last month of the steady ~2% year-over-year inflation rate we’d seen over the past decade. Inflation rose rapidly in 2021 and the first half of 2022. Early signs show we are entering a period of disinflation — a temporary slowing of the pace of price inflation — not deflation, which is a general drop in price level. Said differently, goods and services will get more expensive at a slower rate than we’ve seen over the past two years, which, we suppose, is better than nothing.
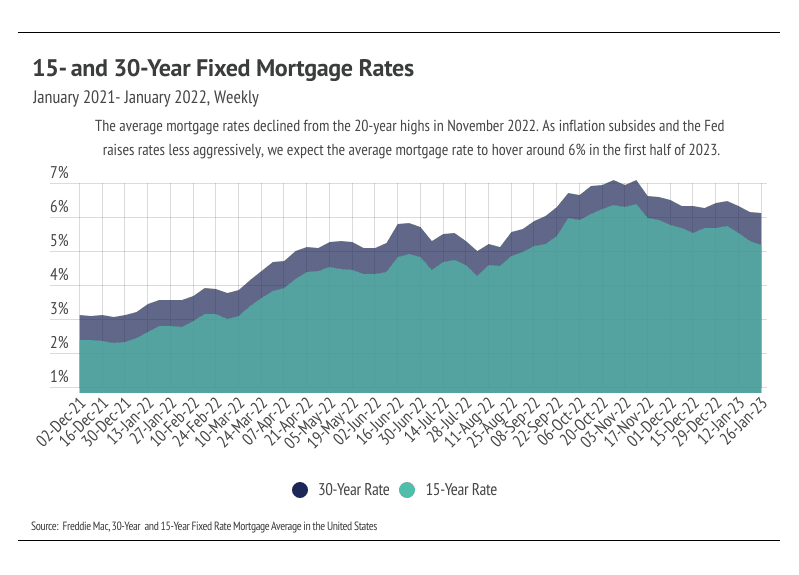
We expect mortgage rates to hover around 6% for the first half of 2023 unless the world’s faith in the United States’ ability to pay its debt obligation further erodes because of Congress’ continued delays in raising the debt ceiling. Mortgage rates are typically about 1.8% higher than 10-year U.S. Treasury bond yields, so a spike in 10-year Treasury yields also spikes mortgage rates. The current Congress certainly seems to be the most amenable to default. However, the likelihood of that happening is low, considering that the politics of a self-inflicted U.S. and global recession not seen since the Great Depression would be, objectively, outside of anyone’s best interests. Were it to happen, though, we would likely see mortgage rates easily near 8% and wealth substantially decrease, pricing many potential buyers out of the housing market.
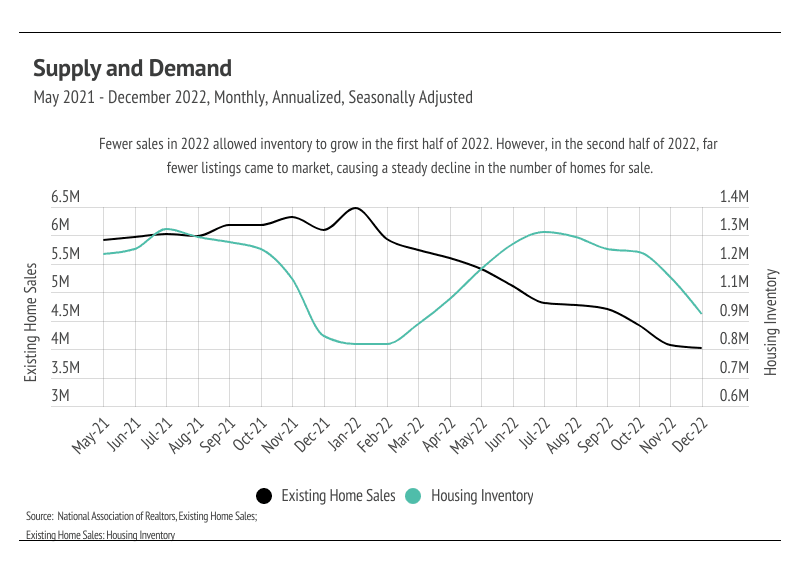
We expect this year to be marked by fewer buyers and sellers, making the market more balanced. On average, sellers can expect fewer offers and far fewer offers above list price than we saw in 2021 and the first half of 2022. Buyers may need more time to find the right home for them as fewer new listings come to market. Different regions and individual houses vary from the broad national trends, so we’ve included a Local Lowdown below to provide you with in-depth coverage of your area. As always, we will continue to monitor the housing and economic markets to best guide you in buying or selling your home.
Note: You can find the charts/graphs for the Local Lowdown at the end of this section.
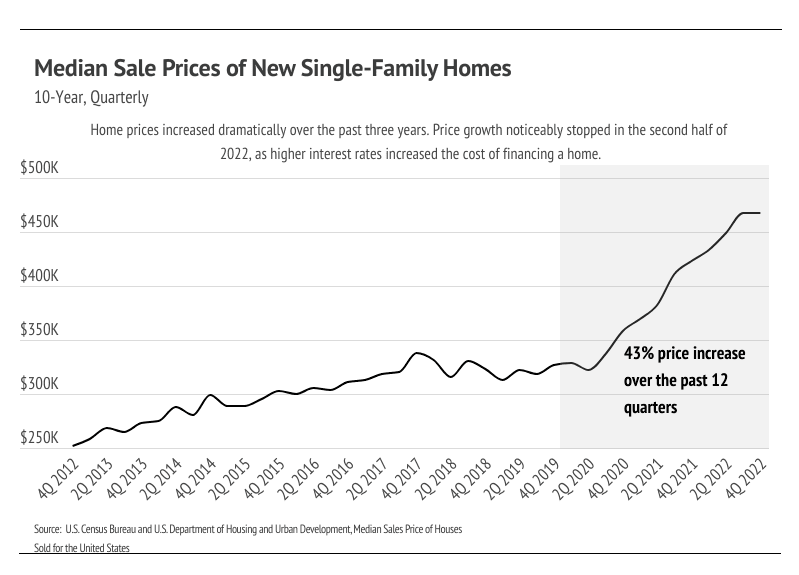
We have enough data to see the trajectory for the next few months, if not the next year. The housing market hasn’t come to a grinding halt — people will always need to move for various reasons — but it has slowed considerably, largely due to financing costs and the aftermath of the buying frenzy from mid-2020 to mid-2022. The 2020-2022 housing market was very efficient compared to now. Real property tends to be much further toward the inefficient side of the spectrum for a slew of reasons: the unique nature of every home, finite amount of land, building expense, number of market participants at any given time, high cost, long holding period, and opaque pricing, which creates a relatively illiquid market. However, the homebuying incentives and dramatic increase in disposable income during the 2020-2022 period shifted the market to a state of ultra-high demand relative to supply, creating a highly liquid market. Homes sold quickly with multiple offers above list price, driving prices to record highs. Most buyers finance their homes through a mortgage loan; this made rising prices less financially impactful when rates went down and significantly more impactful as rates rose.
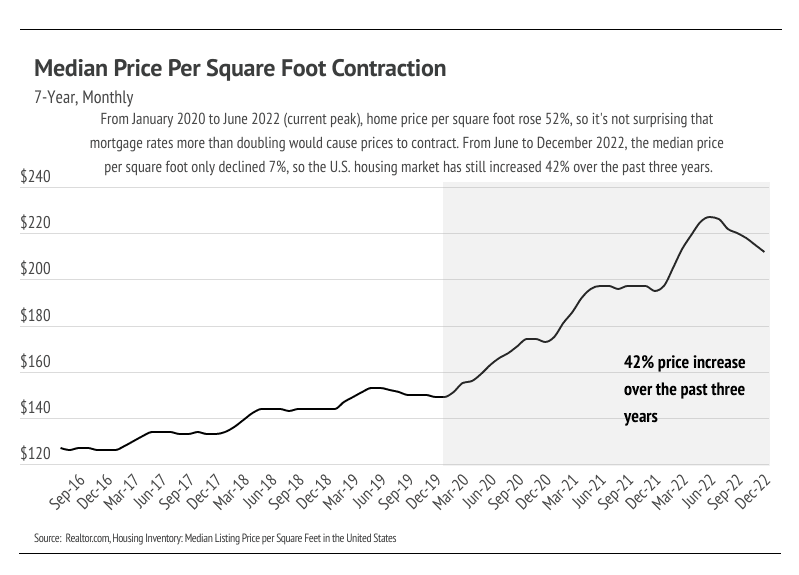
The price and the cost were at odds. For example*, if you took out a $100,000 30-year mortgage in January 2020 at the average rate of 3.51% for the total cost of the home, the principal and interest you’d pay per month was around $449. By December 2021, that home price rose to $130,200, and the average 30-year rate fell to 3.11%, so if you bought that home in December at 3.11%, the monthly cost was $564, a 25.6% increase despite the price increasing 30.2%. If we fast-forward to the present, that home now costs about $135,000 — but mortgage rates have increased significantly, now 6.09%, so the monthly cost increases to $817 per month. In short, when we account for price increases and rate increases, the price of a home has increased 82% over the past three years. Every market has had different price appreciation and contraction levels recently, but everyone currently faces higher mortgage rates.
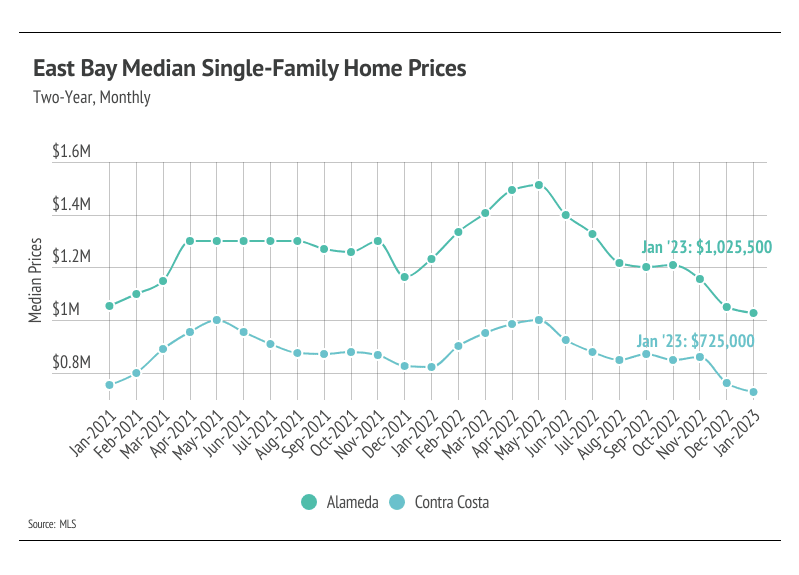
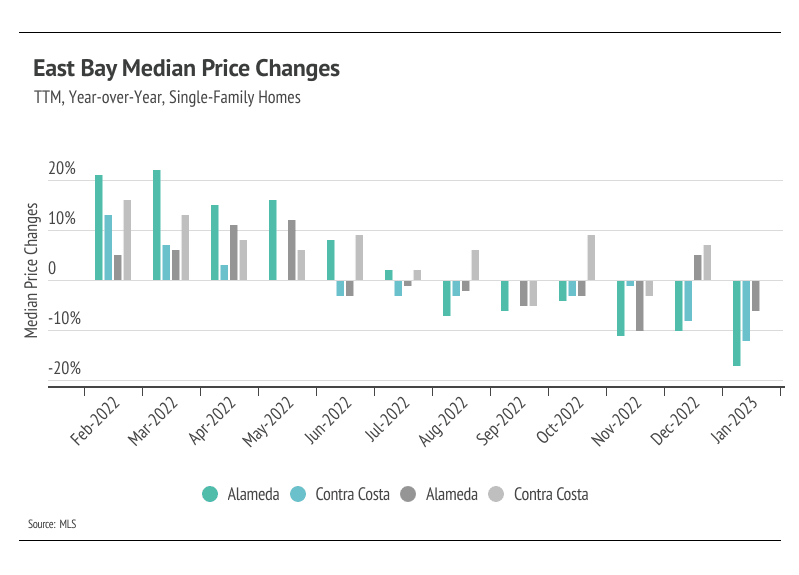
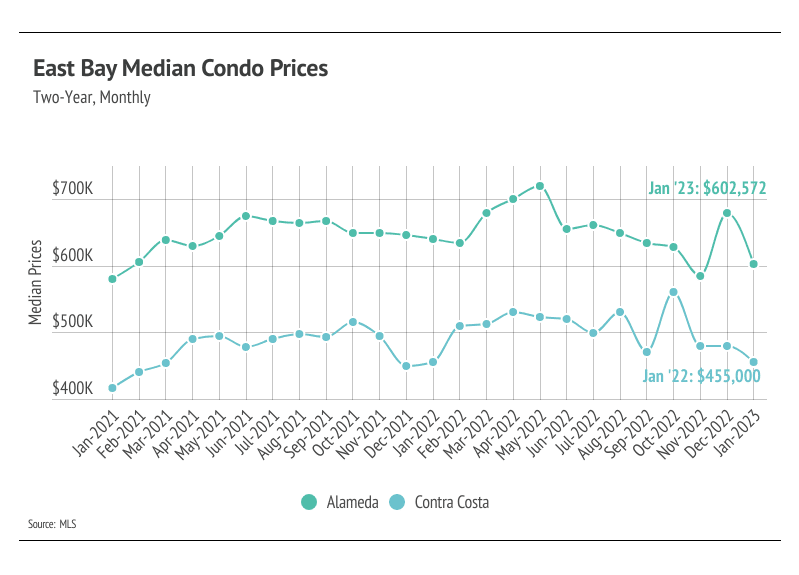
Even with the large contraction in the second half of 2022, single-family home prices increased by 19% in Alameda and 17% in Contra Costa over the past three years, while condo prices increased by 4% in Alameda and 12% in Contra Costa. It’s reasonable to assume that the market will slow after such a dramatic increase in cost, especially since it has already slowed. We’re expecting fewer sellers coming to market and fewer buyers this year.
*We’re using the Case-Shiller 20-City Composite Home Price Index to create an illustrative home price.
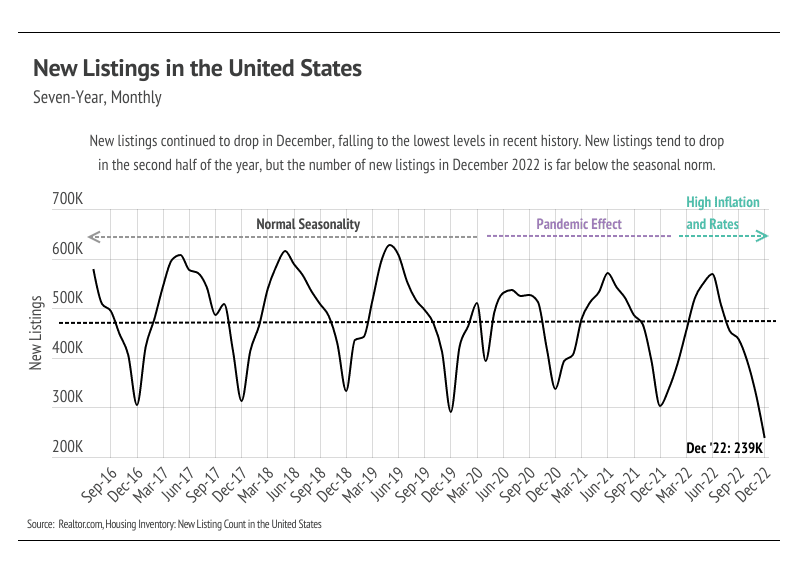
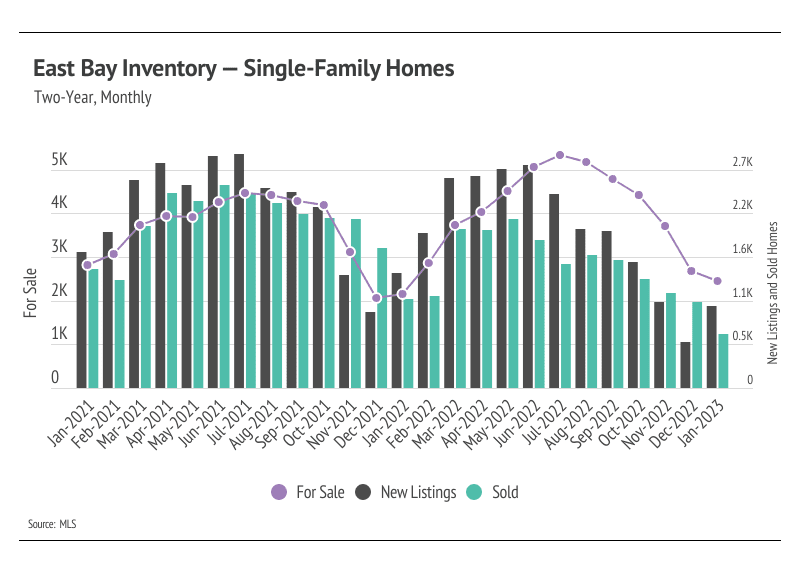
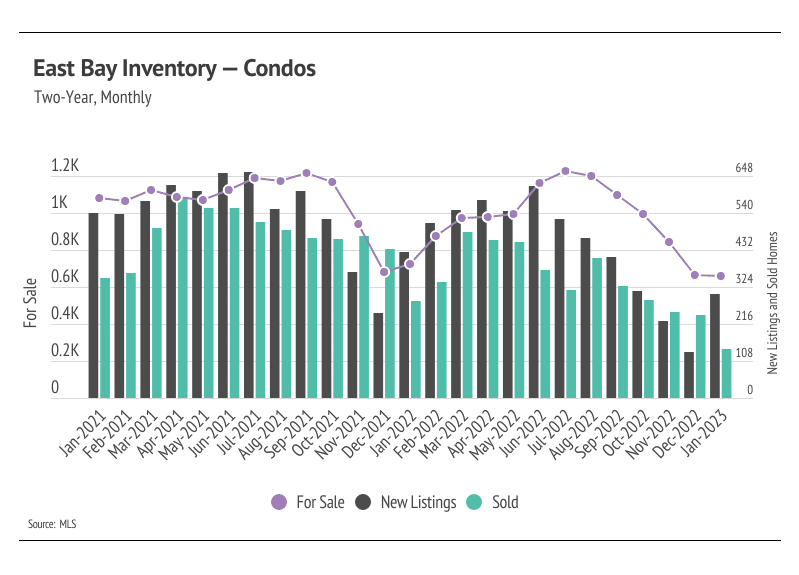
Alameda inventory fell to an all-time low level in January 2023, while the number of homes for sale in Contra Costa landed slightly above the record low reached in December 2021. Higher interest rates have dropped incentives for potential sellers and buyers to enter the market. Homeowners either bought or refinanced recently, locking in a historically low rate, so fewer listings are coming to market. Many potential buyers were priced out of the market as interest rates rose. New listings fell by 29% year-over-year, while sales declined by 41%. We still expect some inventory growth in the first half of the year, but inventory will likely remain low.
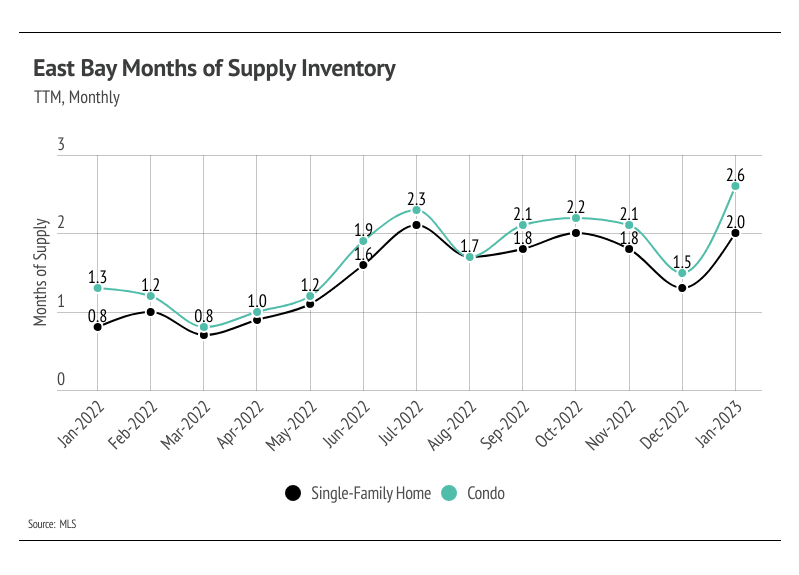
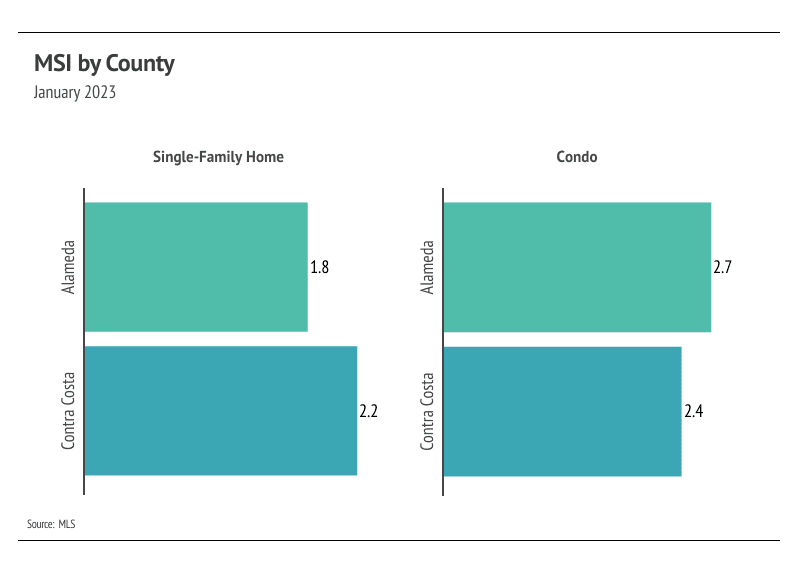
Months of Supply Inventory (MSI) quantifies the supply/demand relationship by measuring how many months it would take for all current homes listed on the market to sell at the current sales rate. The long-term average MSI is around three months in California, which indicates a balanced market. An MSI lower than three indicates more buyers than sellers on the market (meaning it’s a sellers’ market), while a higher MSI indicates more sellers than buyers (meaning it’s a buyers’ market). East Bay MSI moved higher again in January, nearing balance for condos but still a sellers’ market for both single-family homes and condos.
Stay up to date on the latest real estate trends.

Market Update

Agent of the Month
Market Update

Real Estate

Real Estate

Market Update

Real Estate
Market Update

Real Estate
You’ve got questions and we can’t wait to answer them.