August 2023 East Bay Market Report
Market Update

Market Update
Note: You can find the charts & graphs for the Big Story at the end of the following section.
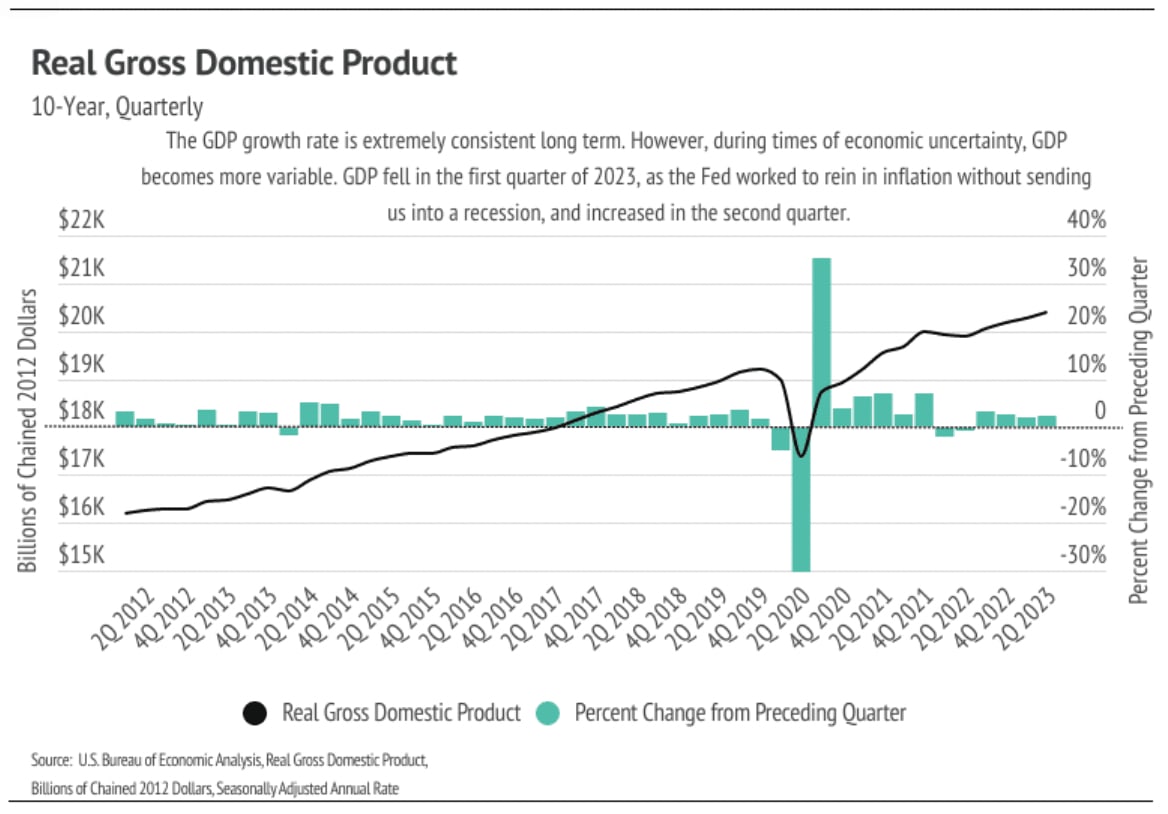
As we embarked on 2023, the economic consensus anticipated a looming recession, yet it hasn't materialized. Happily, the consensus has now shifted towards moderate economic growth. The notion of a "soft landing," which involves curbing inflation without a recession, is more plausible than ever. While the economy isn't flawless, the predominantly positive economic news is gradually fostering a more positive outlook among the general public. Notably, job creation and GDP growth have outperformed expectations in the first half of the year. Inflation is receding rapidly, and consumer confidence has reached its highest point since February 2022. The bounce in home prices can be partially attributed to consumer perception, but other factors are at play. Home prices have risen as concerns of recession have waned, even in the face of higher mortgage rates. Another key factor is the supply shortage, which has significantly contributed to the price rebound. The relatively low yet growing inventory has facilitated swift price increases.
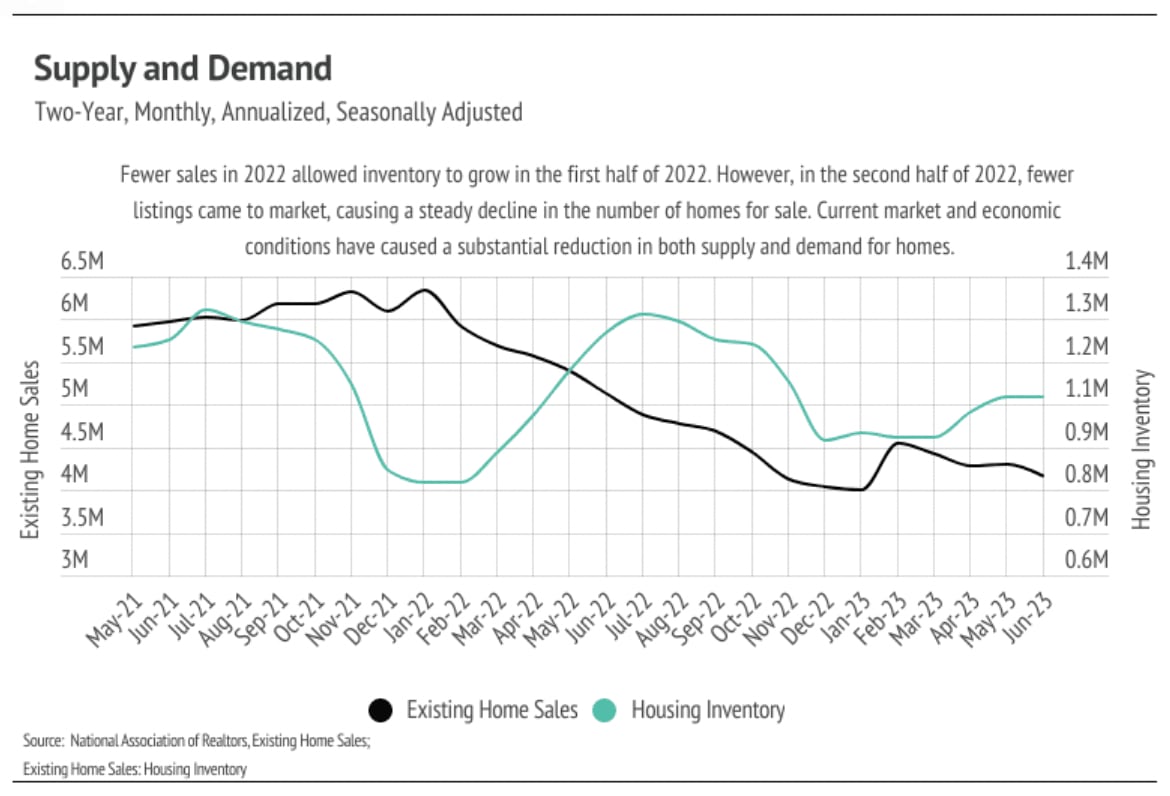
The housing market diverges from the traditional supply-and-demand model seen in Economics 101, primarily because housing is not a simple commodity. Surprisingly, an increase in inventory from historically low levels actually supports prices by expanding choices for potential buyers. Historically, during normal seasonality (pre-pandemic), inventory, listings, sales, and prices all climb from January to July and decrease from July to January. Any departure from the exceptionally low post-pandemic inventory levels benefits buyers, who seek ample options to find their desired homes. This year's price appreciation underscores that buyers are still finding homes that resonate with them even with lower sales figures.
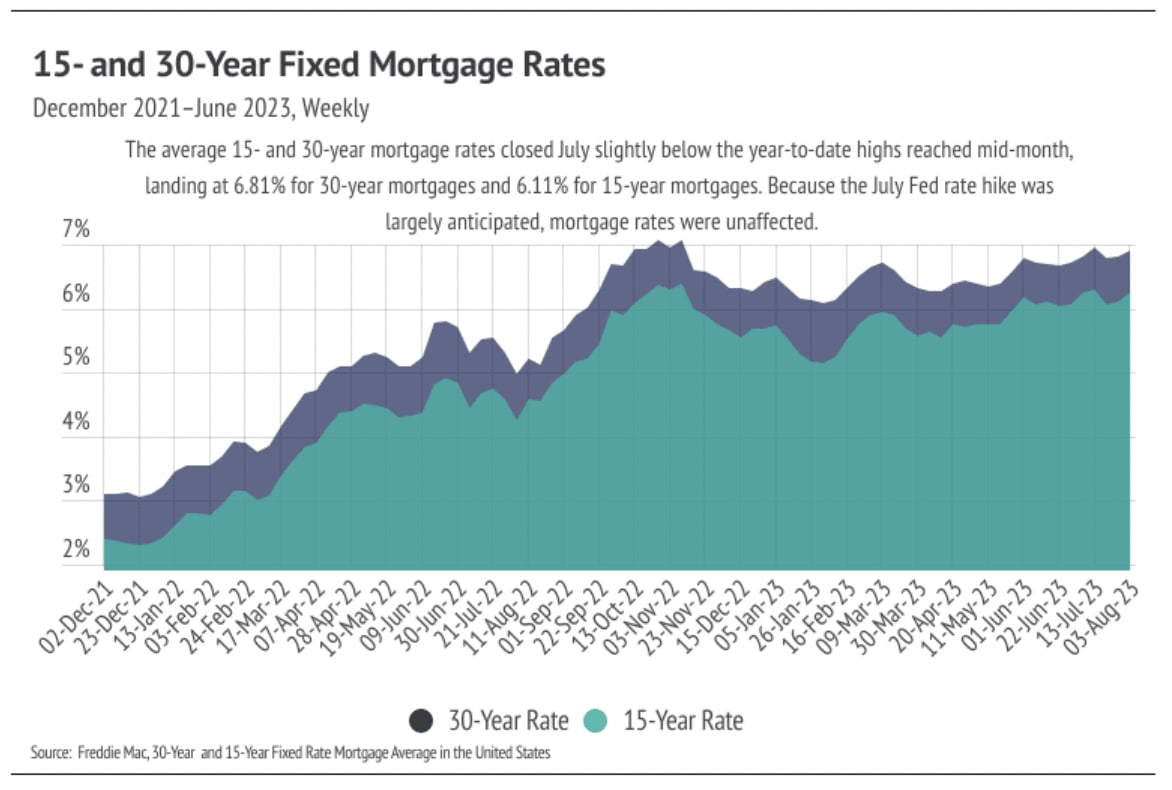
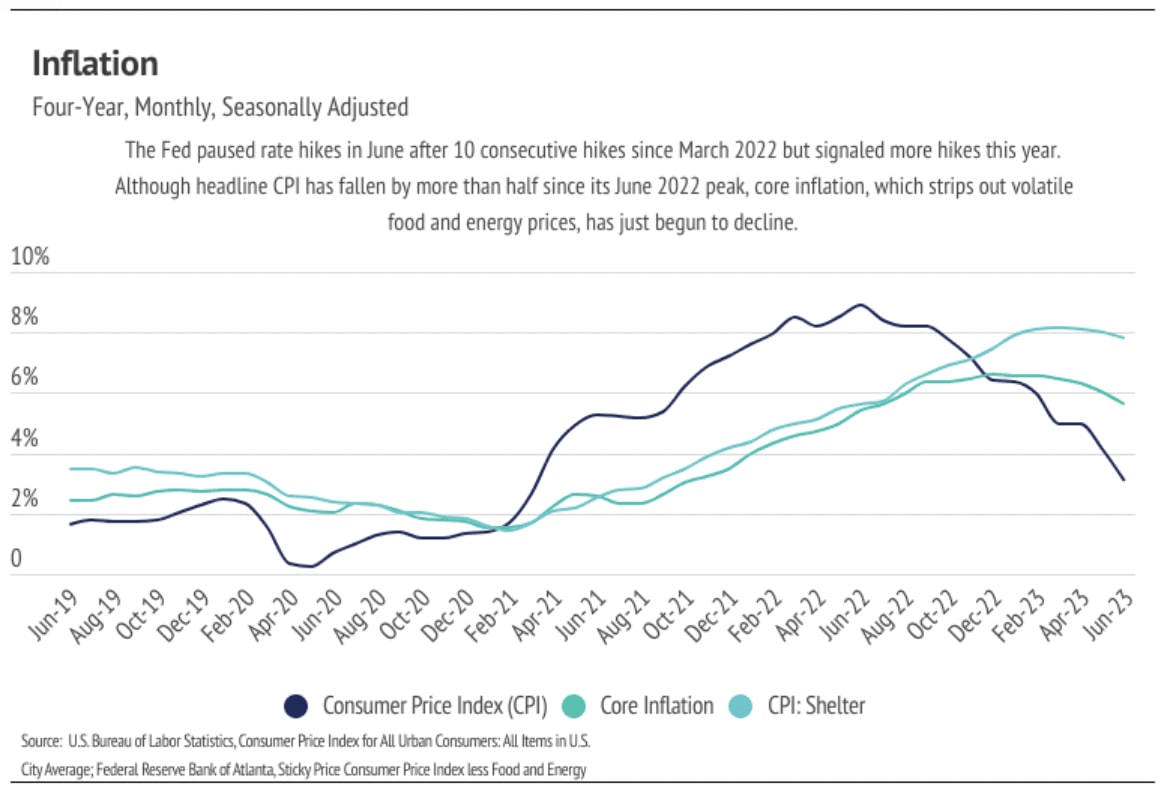
In the Fed's July meeting, board members unanimously voted to elevate the federal funds rate for the 11th time since March 2022, reaching its highest point since 2001. Although headline inflation (measured by the Consumer Price Index or CPI) has dropped by about two-thirds from its June 9% peak, core inflation, excluding volatile food and energy prices, has only fallen by 15%. A significant driver of core inflation is housing. The CPI for shelter has only descended by 5% from its peak in March 2023, which is not surprising given the proximity of prices to their zenith. While the Fed initially expressed a meeting-by-meeting approach to future rate hikes, this was before Fitch's August 1 downgrade of U.S. credit. The downgrade's impact on interest rates is expected to be minimal, but if there is an effect, it might lead to higher rates. The average 30-year mortgage rate reached 6.81% by July's end and 6.90% in the first week of August. Based on data until August 3, the average 30-year mortgage rate is projected to hover between 6.25% and 7.25%.
Diverse regions and individual properties deviate from national trends, hence the inclusion of a "Local Lowdown" below to provide comprehensive area-specific insights. In general, pricier regions (West and Northeast) have felt the impact of mortgage rate increases more than less expensive markets (South and Midwest), due to both the direct cost and limited new home construction ability. As always, we are committed to closely monitoring housing and economic trends to offer optimal guidance for your home buying or selling journey.
Note: You can find the charts/graphs for the Local Lowdown at the end of this section.
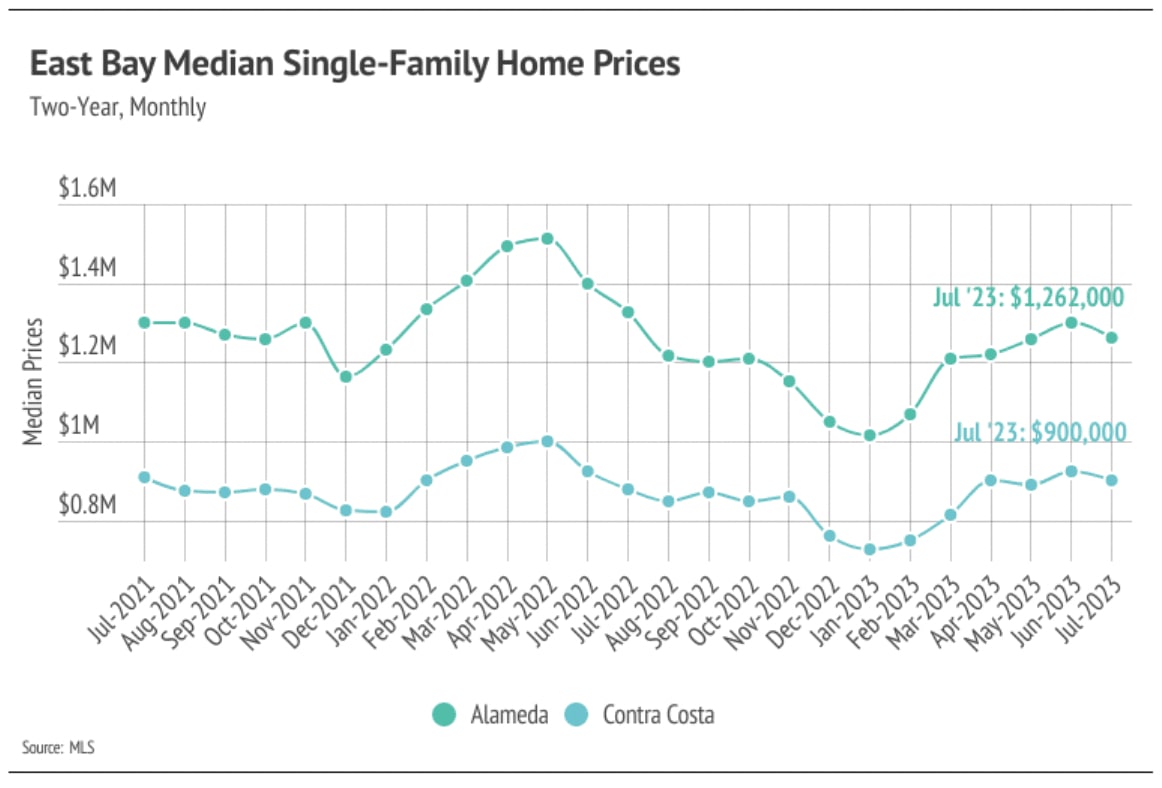
In the East Bay, demand for housing remains consistently strong, particularly during the spring and early summer months. This robust demand, coupled with a gradually increasing inventory, fueled the rapid appreciation in home prices during the first half of the year. As we move into July and August, demand usually softens, potentially alleviating the challenges posed by the persistently low supply. However, while this situation might improve somewhat, it's important to note that the supply remains a consideration. Well-presented new listings are likely to be swiftly snapped up, while less appealing properties might linger on the market. This phenomenon is in line with established trends but has been magnified by the current mortgage rate landscape. Homebuyers today are less inclined to pay a premium for homes in need of significant repairs compared to the trends of 2020 and 2021.
Looking at July, median prices for single-family homes have demonstrated year-to-date growth in North Bay counties. In the latter half of the year, when both sales and new listings typically slow, home prices generally remain steady or might see minor adjustments.
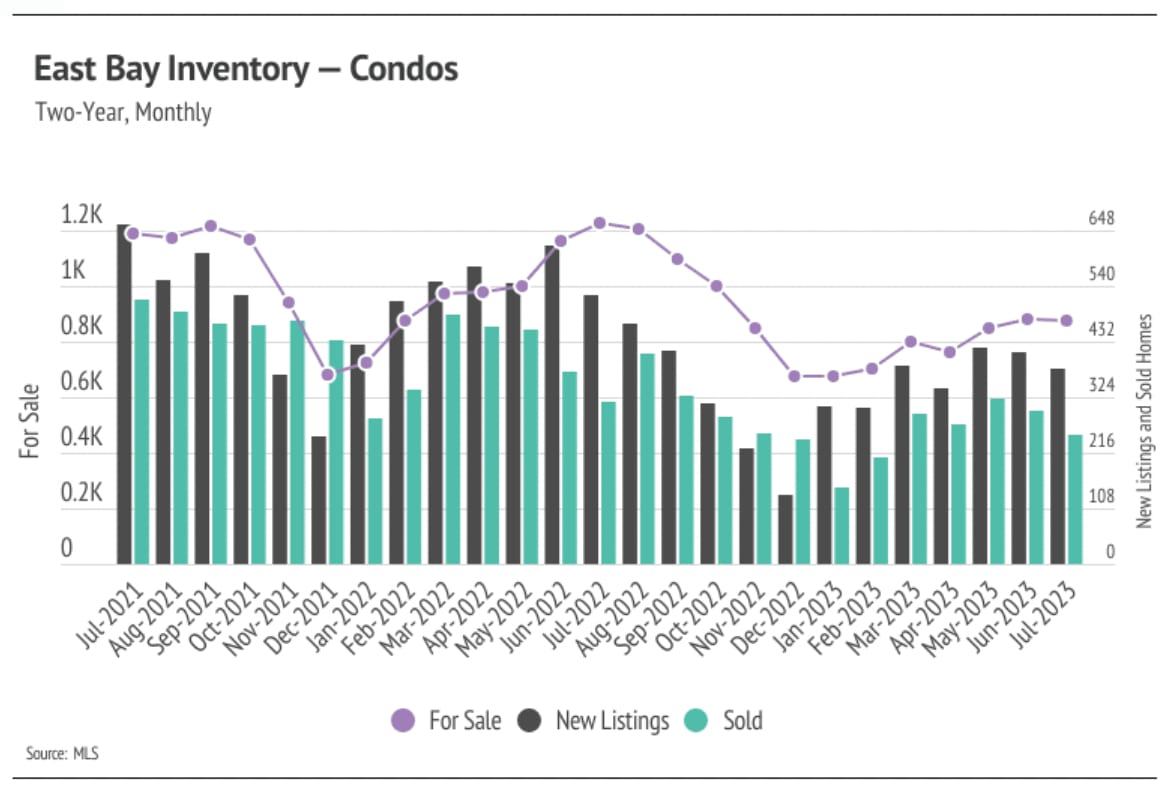
In the first half of the year, there was a notable increase in inventory, sales, and new listings for both single-family homes and condos. However, these metrics are still relatively low. Typically, inventory reaches its peak around July or August and then tapers off through December or January. In this year, it seems that single-family home and condo inventory reached its zenith in June, which might lead to a decline in transactions in the coming months. Given the current scarcity of inventory compared to demand, any influx of new listings is a positive development for the market. Unfortunately, new listings were unusually sparse from January to July 2023, directly affecting inventory and sales figures. The volume of home sales is influenced by the number of active listings and new listings entering the market. Since January 2023, home sales have surged by 82%, while new listings have risen by 52%. By contrast, during the same period last year, sales increased by 34%, and new listings grew by 58% by July.
As the tight inventory persists, sellers are gaining more leverage in negotiations. In January 2023, the average seller received 95% of the listing price, whereas by July, this figure had risen to 104%. Inventory levels are likely to remain historically low throughout the year, resulting in a competitive market landscape throughout the third quarter.
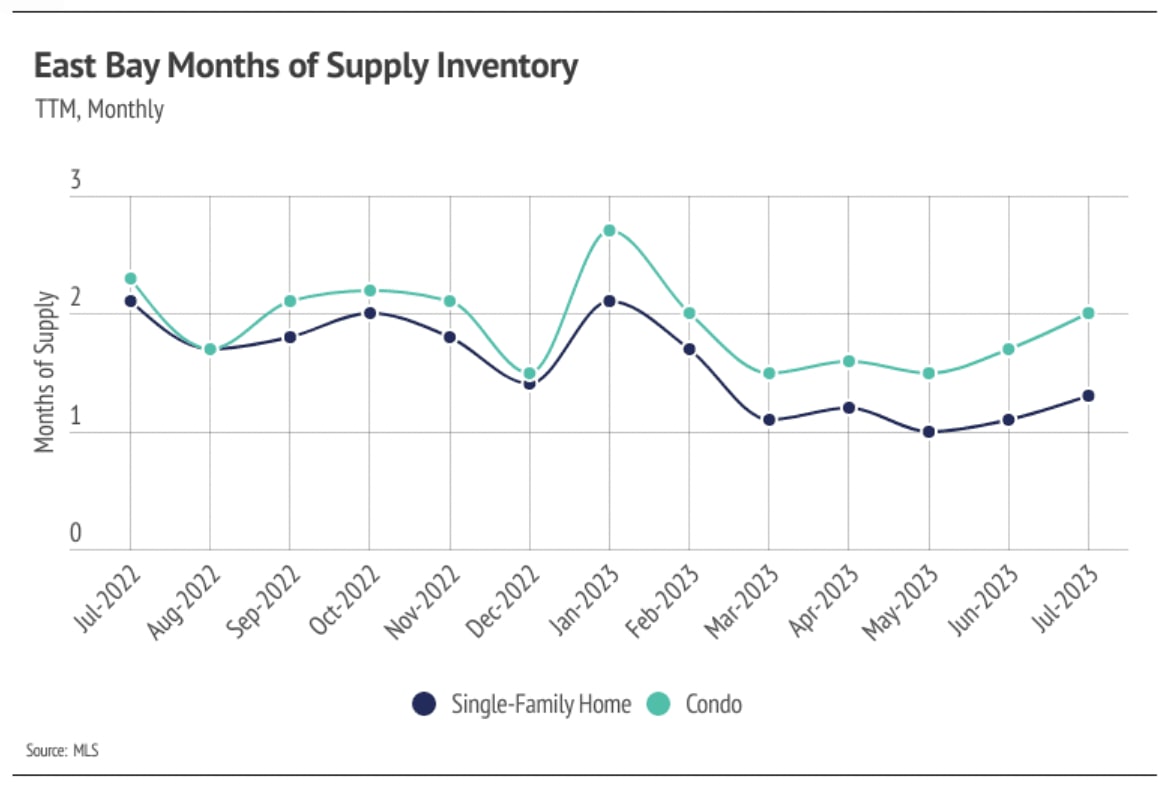
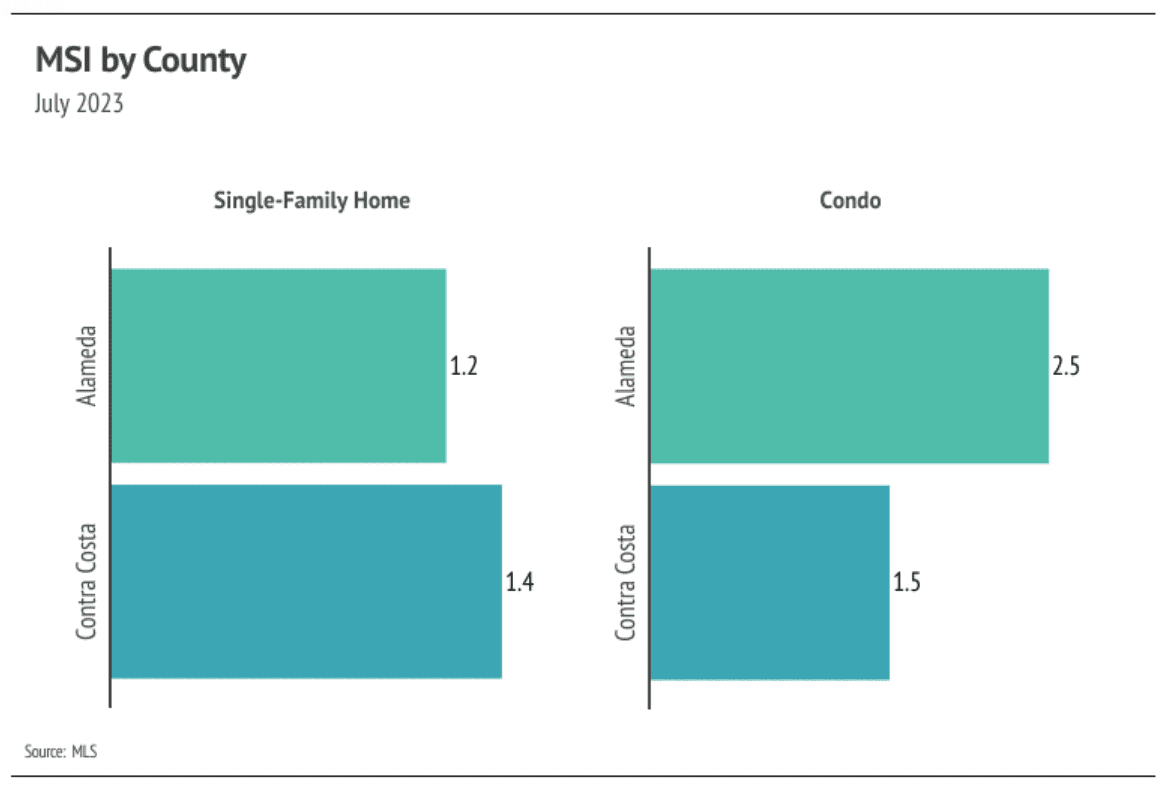
Months of Supply Inventory (MSI) is a metric that gauges the balance between supply and demand in real estate. It calculates the number of months it would take to sell all current listings based on the present sales rate. In California, the typical MSI hovers around three months, signifying equilibrium. An MSI below three implies more buyers than sellers (a sellers’ market), while a higher MSI points to more sellers than buyers (a buyers’ market). In the East Bay, the scale tips in favor of sellers, evident from its low MSI. From January to May 2023, MSI steadily decreased for both single-family homes and condos. Despite a minor uptick in June and July, the market still firmly benefits sellers. This pronounced MSI drop is attributed to a higher sales-to-listing ratio and shorter time on the market.
Stay up to date on the latest real estate trends.

Market Update

Agent of the Month

Market Update

Real Estate

Real Estate

Market Update

Real Estate
Market Update

Real Estate
You’ve got questions and we can’t wait to answer them.